Do you think any one of your web pages is great for every audience?
Older people and young, people who know your brand and those who’ve never heard of you, people who understand your product and those who have no idea what the product is.
All of these people come to your website with different needs, and the typical experience today is to serve a uniform experience to everyone, perhaps with a tailored recommendations carousel. All of the experiments you run again fall into this same trap of trying to find a single winner that is on average best for everyone.
Most ideas I see are great and well thought-out. But somewhere between 50-80% of experiments are “losers”, because you’re hoping for generalised success. And in reality, it solved a problem for a specific cohort of users, but you weren’t looking. That’s where this blog will help to guide you.
Segmenting your way to success
The results for your test will look a little like this:
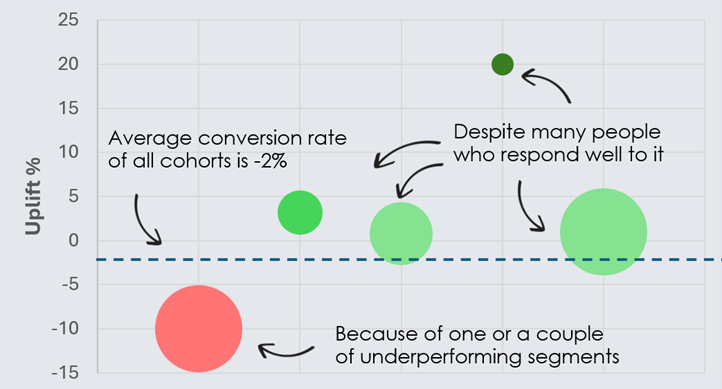
You might have a small audience who love it, some people who hate it, and some people in the middle who aren’t too phased by it.
We draw a line of best-fit through the middle, and that’s the Conversion Rate that we report back on for all of the experiments that you run.
If all you ever look at is the line and not the circles, you conclude that your test performed at -2% and it was a bad idea.
If you paint the cohorts on the chart, it suddenly looks much more interesting, and that line looks a lot less important.
Getting to this view requires us to find good attributes to consume through Custom Data, and segmentation when viewing the reports.
Finding the right attributes to segment by
Example 1: Odeon Cinemas Group
Let’s say we’re running an experiment on this PDP for Odeon Cinemas:

What can we see?
- Film name: Captain America Brave New World
- Movie franchise: Marvel Cinematic Universe
- Genres: Action, Family, Sci-Fi
- Age rating: 12A
- Warnings: moderate violence, bloody images, language
- Director
- Cast
- Etc.
Showing an autoplaying trailer might work great for a big action film like this, but perhaps for a Horror film – perhaps a bad idea.
Example 2: UEFA Euro 2024 Hospitality

Let’s say you’re selling a premium product – in this case hospitality packages to a big football match. You spend significant amounts on paid traffic, deliver a series of highly targeted emails, and users land on the website:
- Through UTM parameters, which have attributes attached to them
- Languages that you land on
Capturing these values, and splitting/grouping UTM parameters based on the targeted attributes, you suddenly have a lot of interesting bits of data to analyse by.
Example 3: Halfords PLP
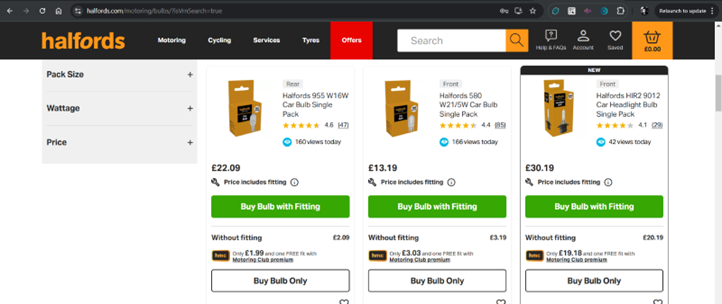
Halfords sell parts for Motoring, Camping, Cycling etc. – and within motoring there’s everything from in-car audio to oil filters.
If they were to build a more visual PLP, it would be reasonable to assume that people looking for bicycles might respond differently to those looking for a specific type of brake pad.
In all of these cases, collecting just a few attributes in a single event along with your Experiment View gets us moving.
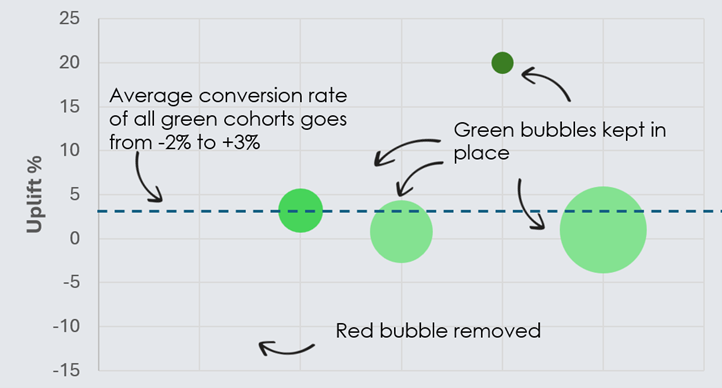
Find and remove the red bubbles
Think back to our bubbles. Red ones are dragging own our experiment and green ones are lifting it up. The conversion rate line is just the average.
So what might your test look like without the red bubbles?
This type of analysis can be as straightforward in the Optimize UI as applying a “metrics triggered includes genre_action” filter to your dataset, and seeing what comes out the other end.
With all underperformers removed, your tests are far more likely to succeed. And you can look to then shift the conversation from “does this work for every single cohort coming to the website?” to “are the winning cohorts big enough to target and manage long-term”, which is where Webtrends Optimize can again support you with handling running these projects at scale.
To summarise
A lot of programmes try to find a single generic winner, for the many hundreds of cohorts coming to your websites.
By capturing even one or two additional attributes in your test as a conversion event or custom data, you can shift the conversation from “this test didn’t do so well” to “here’s who loved it, here’s who hated it”.
These very easy steps, which we estimate would take no longer than 15 minutes for an experienced developer to add to your test, entirely rewrite the narrative of why you’re testing, what you’re hoping to achieve, and what a successful test even means.
Happy personalising!
